Pie Chart is a pictorial representation of proportions in a whole as sectors in a circle.
Draw Pie Chart in R programming language
R programming language provides two functions – pie() and pie3d() to draw pie charts.
Syntax of R pie function
pie(x, labels = NULL, edges = 200, radius = 0.8, clockwise = FALSE, init.angle = 0, density = NULL, angle = 0, col = NULL, border = NULL, lty = NULL, main = NULL, …)
where
- x [mandatory] is a numerical vector with values >=0. Each values decides the proportion of circle.
- labels is a character vector. They are names for the slices.
- edges the circular outline of the pie is approximated by a polygon with this many edges.
- radius of the circle in pie chart.
- clockwise represents the logical indicating if slices are drawn clockwise or counter clockwise. counter clockwise is default. {TRUE,FALSE}
- init.angle is the initial angle(in degrees) to start with for drawing sectors. [0,360]
- density of shading lines, in lines per inch
- angle is the slope of shading lines in degrees (counter-clockwise).
- col is a vector of colors to be used in filling or shading the slices.
- border, lty – arguments passed to polygon which draws each slice.
- main is an overall title for the plot.
- … is graphical parameters can be given as arguments to pie. They will affect the main title and labels only.
Example 1 – Simple Pie Chart
Simple pie chart
# Data Pie chart
x = c(4, 1, 3, 1, 2)
labels = c('breakfast', 'brunch', 'lunch', 'snacks', 'dinner')
colors = c('#4286f4','#bb3af2','#ed2f52','#efc023','#ea7441')

# Give the chart file a name.
png(file = "diet.png")

# Plot the chart.
pie(x, labels, main='Daily Diet Plan', col=colors, init.angle=180, clockwise=TRUE)

# Save the file.
dev.off()
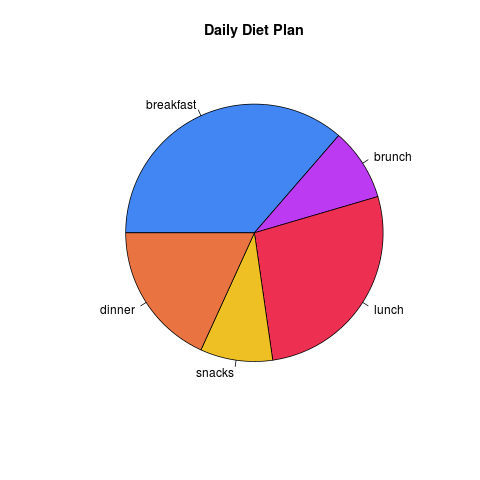
When the above program is run, following pie chart is created at the location of your Rscript.
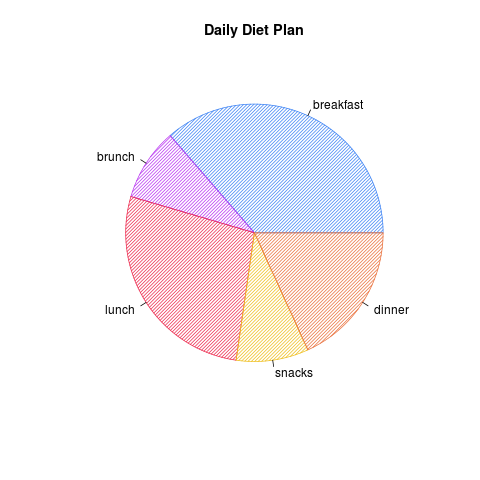
Example 2 – Pie Chart with Striped Lines
Pie Chart with Striped Lines
# Draw Pie Chart in R
# Data Pie chart
x = c(4, 1, 3, 1, 2)
labels = c('breakfast', 'brunch', 'lunch', 'snacks', 'dinner')
colors = c('#4286f4','#bb3af2','#ed2f52','#efc023','#ea7441')

# Give the chart file a name.
png(file = "diet.png")

# Plot the chart.
pie(x, labels, main='Daily Diet Plan',density=30 ,col=colors, angle=45)

# Save the file.
dev.off()
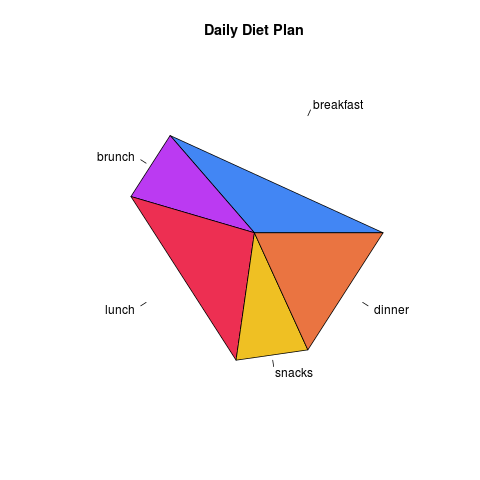
Example Pie Chart with Edged sectors
Pie Chart with Striped Lines
# Draw Pie Chart in R
# Data Pie chart
x = c(4, 1, 3, 1, 2)
labels = c('breakfast', 'brunch', 'lunch', 'snacks', 'dinner')
colors = c('#4286f4','#bb3af2','#ed2f52','#efc023','#ea7441')

# Give the chart file a name.
png(file = "diet.png")

# Plot the chart.
pie(x, labels, main='Daily Diet Plan',edges=1 ,col=colors)

# Save the file.
dev.off()
Syntax of R pie3D function
plotrix library is required to use it in an Rscript
pie3D(x,edges=NA,radius=1,height=0.1,theta=pi/6,start=0,border=par(“fg”), col=NULL,labels=NULL,labelpos=NULL,labelcol=par(“fg”),labelcex=1.5, sector.order=NULL,explode=0,shade=0.8,mar=c(4,4,4,4),pty=”s”,…)
x [mandatory] is a numerical vector with values >=0. Each values decides the proportion of circle.where
- labels is a character vector. They are names for the slices.
- radius of the circle in pie chart.
- col is a vector of colors to be used in filling or shading the slices.
- main is an overall title for the plot.
- explode is the amount by which sectors are exploded
- … extra arguments
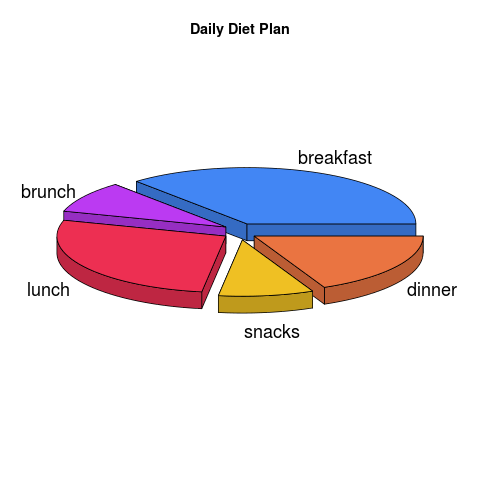
Example 1 – Simple 3D Pie Chart in R
Simple 3D Pie Chart in R programming language
# Draw Pie Chart in R
# Get the library.
library(plotrix)

# Data for Pie chart
x = c(4, 1, 3, 1, 2)
labels = c('breakfast', 'brunch', 'lunch', 'snacks', 'dinner')
colors = c('#4286f4','#bb3af2','#ed2f52','#efc023','#ea7441')

# Give the chart file a name.
png(file = "diet3d.png")

# Plot the chart.
pie3D(x, labels=labels, explode=0.1, height=0.05, main='Daily Diet Plan', col=colors)

# Save the file.
dev.off()
When the above program is run, following pie chart is created at the location of your Rscript.