Line Graph represents relation between two variables.
Plot a line graph in R
We shall learn to plot a line graph in R programming language with the help of plot() function.
Syntax of plot() function
plot(x, y, ...)
where
- x is any R object with a plot method. Ex : numeric vector
- y is any R object with a plot method. Ex : numeric vector
- … is the extra arguments that could be provided, which may contain any of the following
- type – type could be any of the below values
- ‘p’ – points
- ‘l’ – lines
- ‘b’ – both points and lines
- ‘c’ – for the lines part alone of both points and lines
- ‘o’ – for both points and lines overplotted
- ‘h’ – generates kind of histogram view
- ‘s’ – for stair step look
- ‘S’ – other steps
- ‘n’ – no plotting
- main is the main title for the plot
- sub is the sub title for the plot
- xlab is the x label i.e., title for x-axis
- ylab is the y label i.e., title for y-axis
- asp is the aspect ratio whose value should be given by y/x
- lwd is the line width
- pch is the point character. There are 25 symbols to choose from including alphabetic characters
- col gives the color to points and line
- type – type could be any of the below values
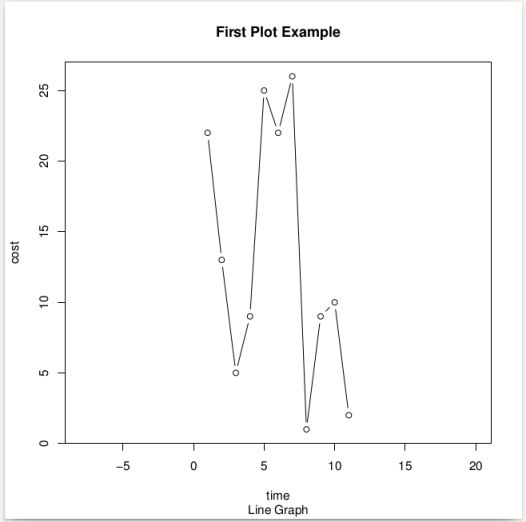
Example 1 : Line Graph
Line Graph
# R program to plot line graph
x = c(1,2,3,4,5,6,7,8,9,10,11)
y = c(22,13,5,9,25,22,26,1,9,10,2)

# plot function
# except x,y ; rest are optional
plot(x, y, type='b', main='First Plot Example', sub='Line Graph', xlab='time', ylab='cost', asp=1)
When the above program is run, plot would be generated as a pdf file, by default.
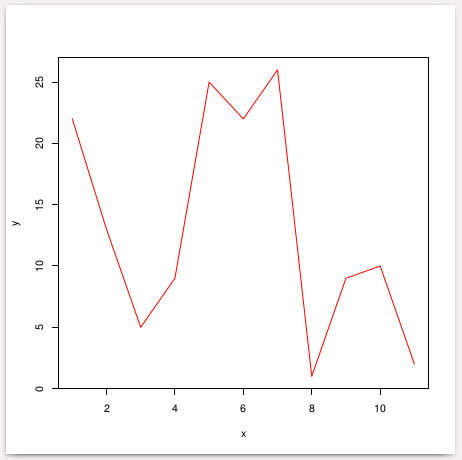
Example 2 : Line, No points, Colored line
Plot Colored Line Graph
# R program to plot line graph
x = c(1,2,3,4,5,6,7,8,9,10,11)
y = c(22,13,5,9,25,22,26,1,9,10,2)

# plot function
# except x,y ; rest are optional
plot(x, y, type='l', col='#ff0000')
Output Line Graph Plot
Example 3 : Points, No Line, Colored points
Plot Colored Line Graph
# R program to plot line graph
x = c(1,2,3,4,5,6,7,8,9,10,11)
y = c(22,13,5,9,25,22,26,1,9,10,2)

# plot function
# except x,y ; rest are optional
plot(x, y, type='p', col='#0000ff')
Output Point Graph Plot

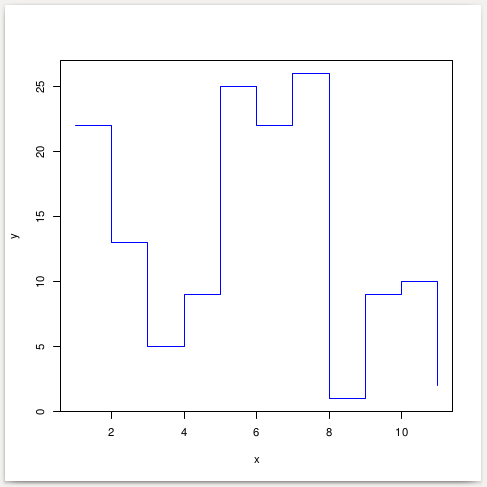
Example 4 : Stair Step Graph
Plot Colored Line Graph
# R program to plot stair graph
x = c(1,2,3,4,5,6,7,8,9,10,11)
y = c(22,13,5,9,25,22,26,1,9,10,2)

# plot function
plot(x, y, type='s', col='#0000ff')
Output Stair Graph Plot