
The definition:
The sample mean will approximately be normally distributed for large sample sizes, regardless of the distribution from which we are sampling.
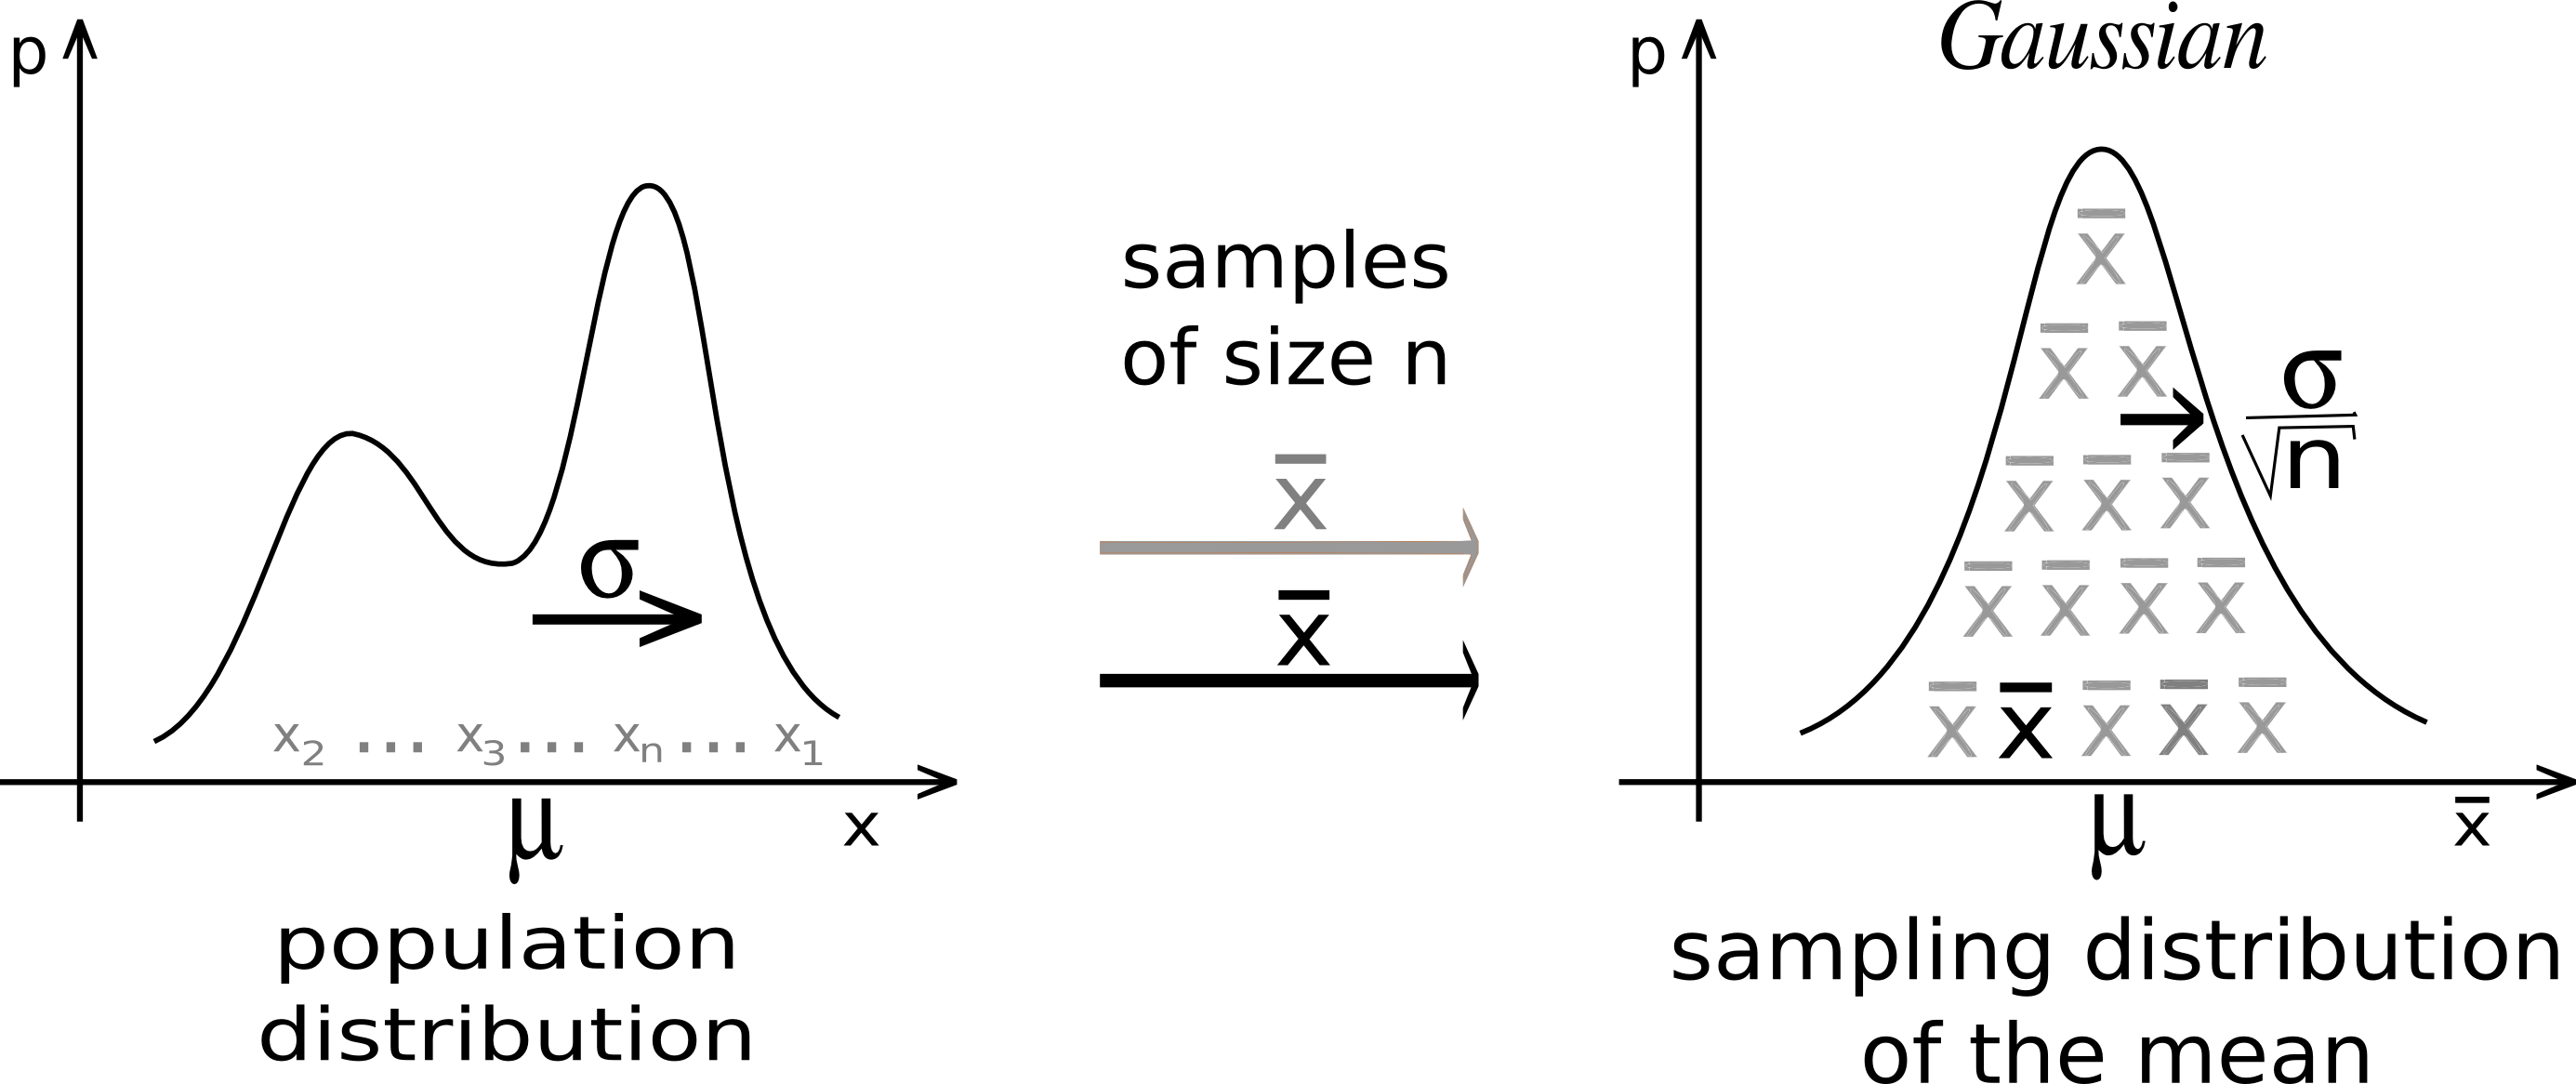
Suppose we are sampling from a population with a finite mean and a finite standard-deviation(sigma). Then Mean and standard deviation of the sampling distribution of the sample mean can be given as: 
Where  represents the sampling distribution of the sample mean of size n each,
  and
and  are the mean and standard deviation of the population respectively.
The distribution of the sample tends towards the normal distribution as the sample size increases.
Code: Python implementation of the Central Limit Theorem
- python3
import numpy
import matplotlib.pyplot as plt

# number of sample
num = [1, 10, 50, 100]
# list of sample means
means = []

# Generating 1, 10, 30, 100 random numbers from -40 to 40
# taking their mean and appending it to list means.
for j in num:
    # Generating seed so that we can get same result
    # every time the loop is run...
    numpy.random.seed(1)
    x = [numpy.mean(
        numpy.random.randint(
            -40, 40, j)) for _i in range(1000)]
    means.append(x)
k = 0

# plotting all the means in one figure
fig, ax = plt.subplots(2, 2, figsize =(8, 8))
for i in range(0, 2):
    for j in range(0, 2):
        # Histogram for each x stored in means
        ax[i, j].hist(means[k], 10, density = True)
        ax[i, j].set_title(label = num[k])
        k = k + 1
 plt.show()
Output:
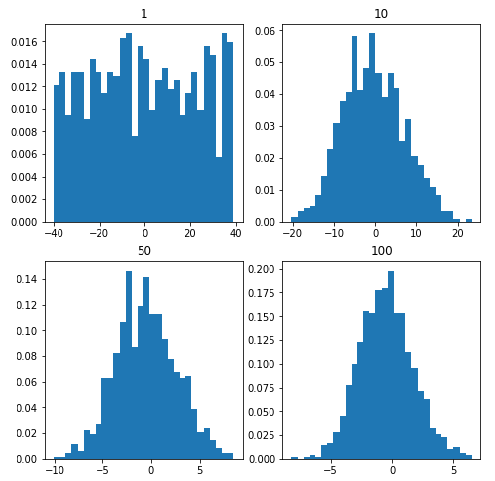
It is evident from the graphs that as we keep on increasing the sample size from 1 to 100 the histogram tends to take the shape of a normal distribution.
Rule of thumb:
Of course, the term “large” is relative. Roughly, the more “abnormal” the basic distribution, the larger n must be for normal approximations to work well. The rule of thumb is that a sample size n of at least 30 will suffice.
Why is this important?
The answer to this question is very simple, as we can often use well developed statistical inference procedures that are based on a normal distribution such as 68-95-99.7 rule and many others, even if we are sampling from a population that is not normal, provided we have a large sample size.