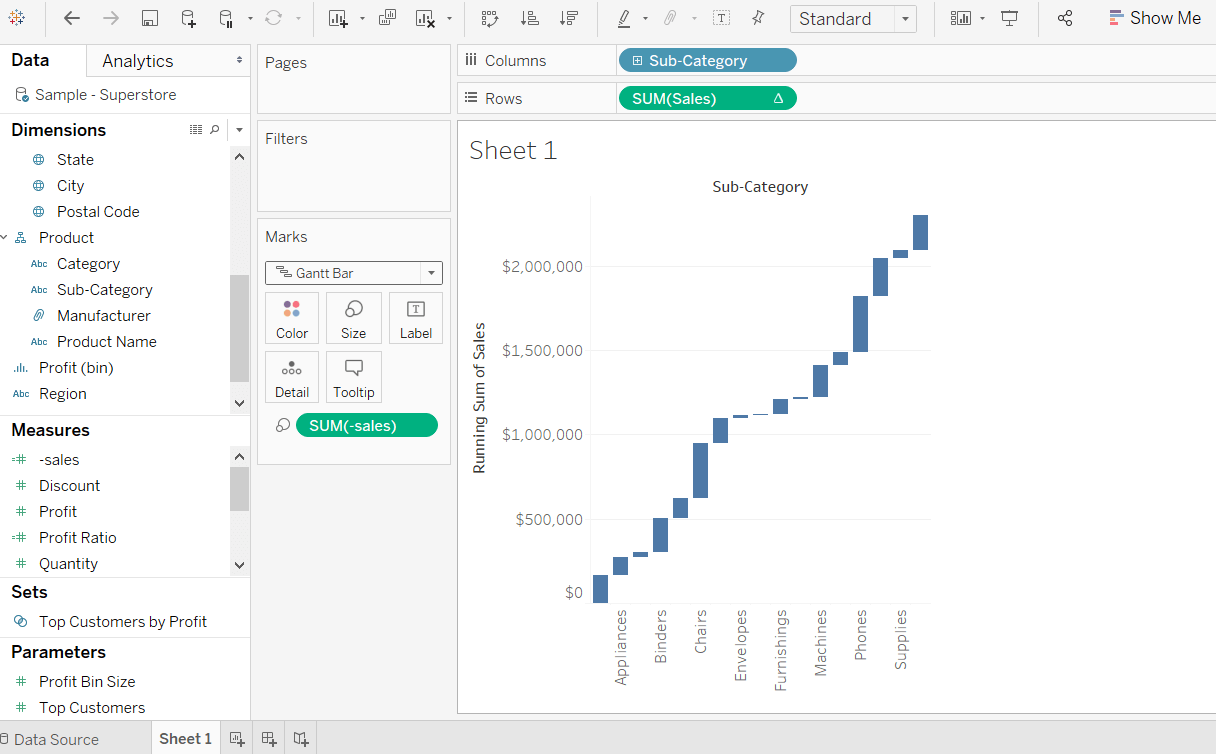
Waterfall Chart is visualizing the cumulative effect of measures over dimensions. It also can show the contribution of growth and decline by each member in dimensions.
Also, Waterfall charts display the cumulative effect of sequential positive and negative values. It shows where an amount starts, ends and how it gets there incrementally. So, we can see both the size of changes and difference in values between consecutive data points.
Tableau needs only one Dimension and one Measure to create a Waterfall chart.
For example, the data source such as Sample-Superstore now sees the contribution of Sales by each Sub-Category using a waterfall chart.
In Tableau, the waterfall chart will be designed by following the given steps.
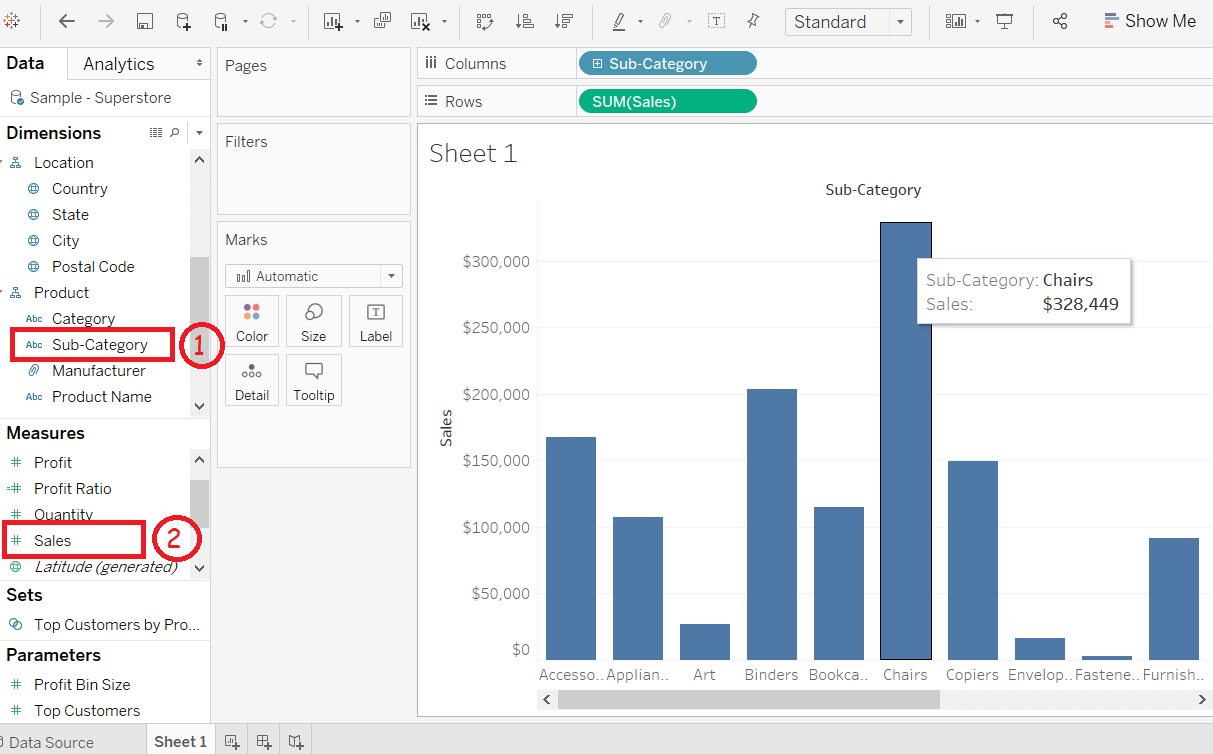
Step1: Go to the worksheet.
- Drag the dimension Sub-Category into the column shelf.
- Drag the measure Sales into the rows shelf.
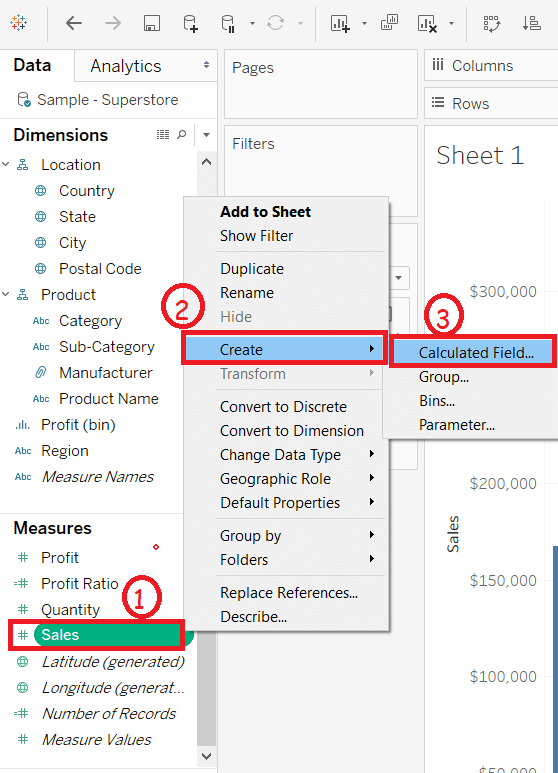
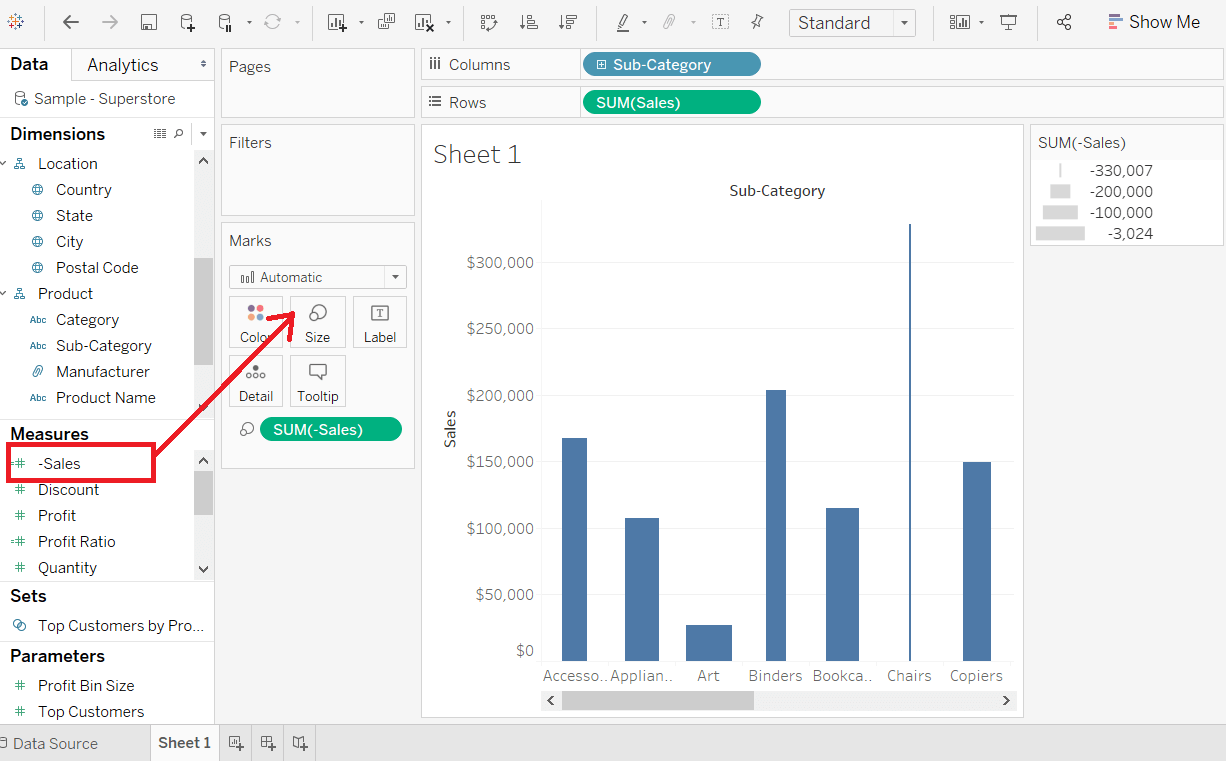
Step2: Right click on the Sales field present in the measures shelf.
Step3: Choose to “Create” option from the list.
Step4: And then select the “Calculated Field” option.
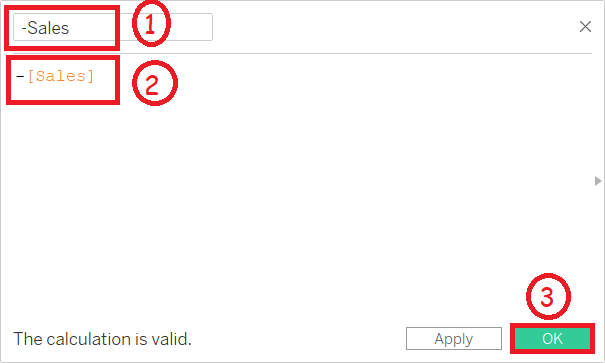
Step5: It open Calculates Field window. Then,
- Enter the name of calculates field such as -Sales.
- Write the expression “-[Sales]” in the calculation area shown in the below screenshot.
- Click on the OK button.
Step6: Drag the newly created calculation field “-Sales” into the Size shelf under the Marks pane.
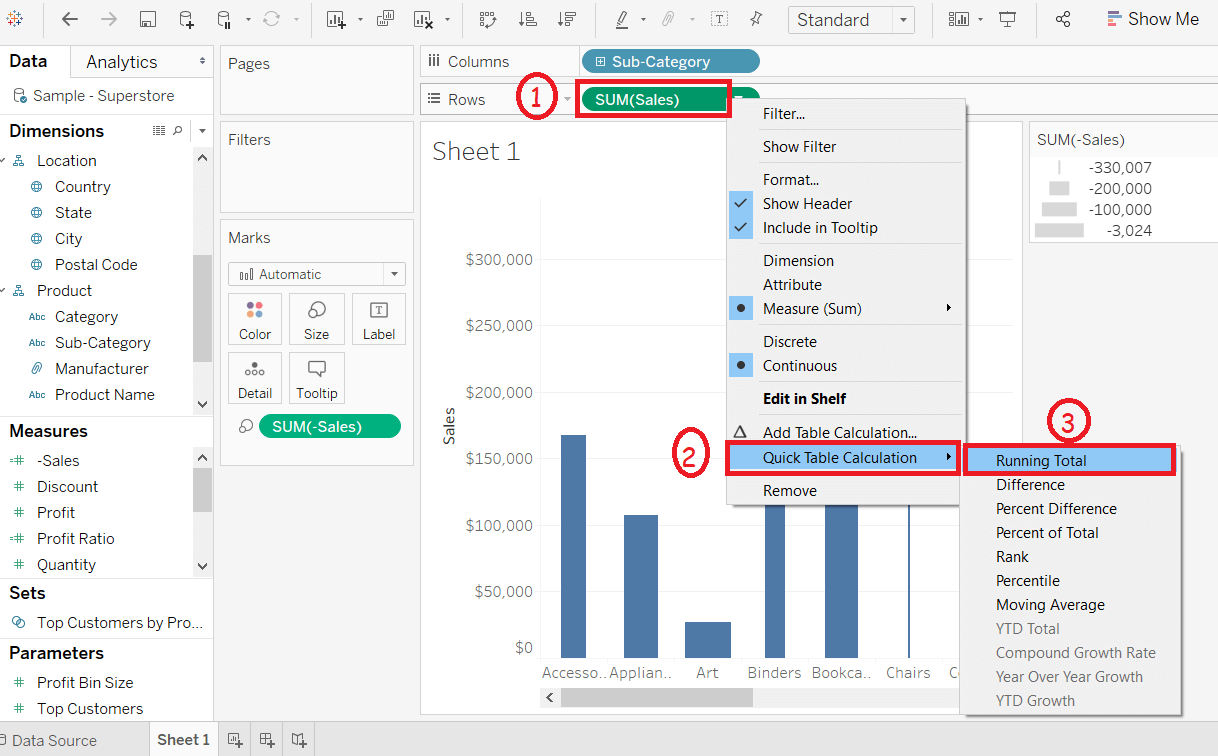
Step7: Right click on the SUM(Sales) present in the rows shelf.
Step8: Select the Quick Table Calculation from the list.
Step9: Then click on the Running Total option.
Step10: Click on the drop-down option in the marks pane.
Step11: Select the Gantt chart option from the list.
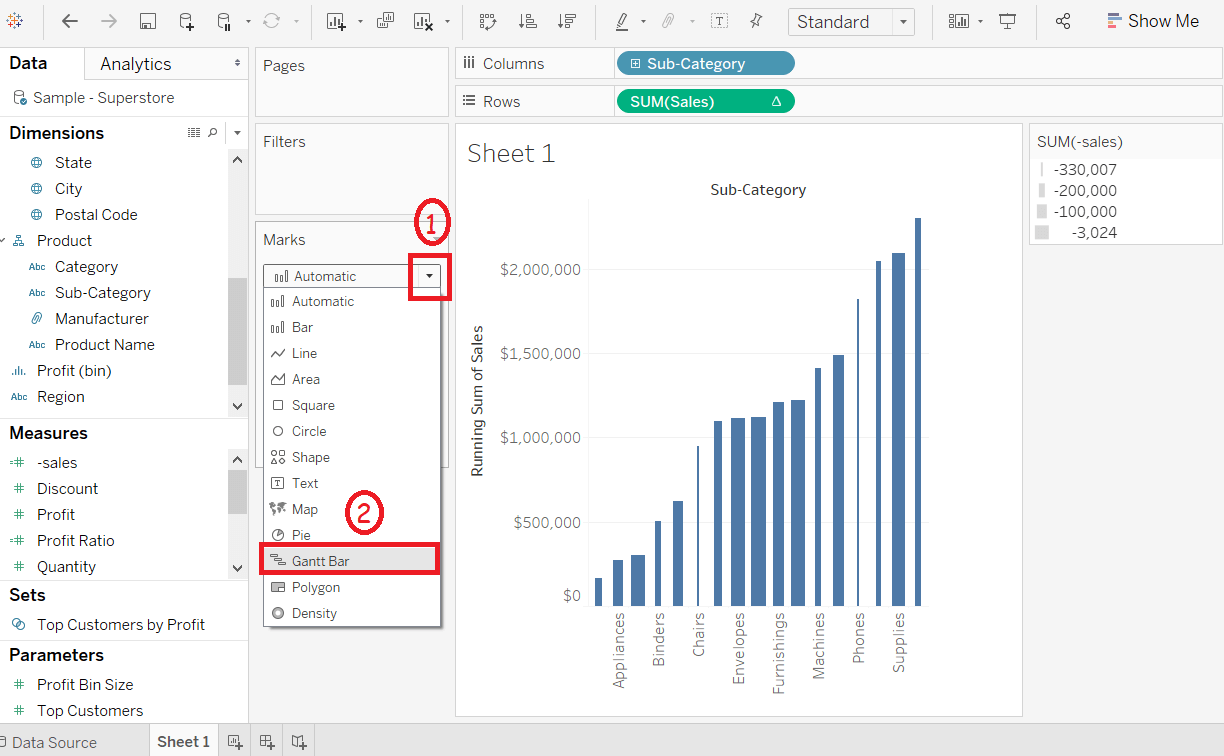
After complete above all the steps, it creates the waterfall chart shown in the below screenshot.