
What is Supervised Machine Learning?
Supervised machine learning is a learning model in which we train the machine by input and what is the desired output. Basically, we will train the model with a set of input variables(x) and the corresponding output variables(y) and try to create a relation between them using functions such as Y = f(x). We made a machine to learn by using these parameters so that it can able to detect the more accurate output even for the new input parameters. So this type of learning of machines is called supervised machine learning and practically most used learning algorithm.
How Supervised Machine Learning Works?
In the supervised machine learning model, we will give a set of input data labels and corresponding output labels so that the model can learn from it and predict accurately when a new input is given. Basically, this is a model that will take known inputs and outputs and trains the model to predict accurately for future input data. This is like an algorithm learning from the input data labels which are like a teacher who supervises the learning of a student (here it is machine).
As we already know the answer for a given input but we want a machine to predict the answer iteratively until we get the reasonable performance from the algorithm or model. During every iteration, it will predict the output and based on that we will give feedback to the model or correct it if requires based on the prediction. During the algorithm training, it creates or defines rules between the input and output parameters. For example, we will train the model with handwritten digits with labels and their output labels when a new image is given with numbers in it, the model able to predict the accurate label.
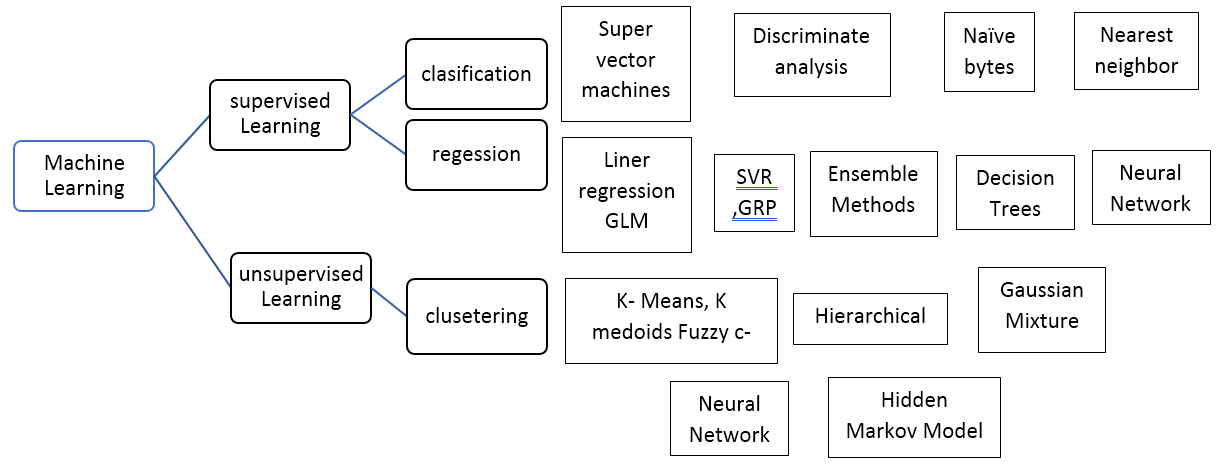
Supervised machine learning uses two techniques classification and regression.
- Classification: It is like True or False statements for example whether an email is a spam or not, whether a tumour is benign or not.
- Regression: It is predicting continuously like temperature prediction, prediction of output which is really like weight, money value on that day, trading prediction, etc.
There are many algorithms that will come under supervised machine learning using classification and regression techniques like linear regression, logistic regression, decision trees, random forests, and support vector machines, etc.
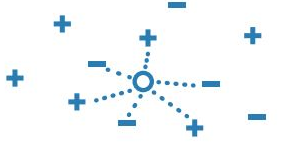
Classification
Imagine you want to predict the gender of a customer for a commercial. You will start gathering data on the height, weight, job, salary, purchasing basket, etc. from your customer database. You know the gender of each of your customer, it can only be male or female. The objective of the classifier will be to assign a probability of being a male or a female (i.e., the label) based on the information (i.e., features you have collected). When the model learned how to recognize male or female, you can use new data to make a prediction. For instance, you just got new information from an unknown customer, and you want to know if it is a male or female. If the classifier predicts male = 70%, it means the algorithm is sure at 70% that this customer is a male, and 30% it is a female.
The label can be of two or more classes. The above example has only two classes, but if a classifier needs to predict object, it has dozens of classes (e.g., glass, table, shoes, etc. each object represents a class)
Regression
When the output is a continuous value, the task is a regression. For instance, a financial analyst may need to forecast the value of a stock based on a range of feature like equity, previous stock performances, macroeconomics index. The system will be trained to estimate the price of the stocks with the lowest possible error.
| Algorithm Name | Description | Type |
| Linear regression | Finds a way to correlate each feature to the output to help predict future values. | Regression |
| Logistic regression | Extension of linear regression that’s used for classification tasks. The output variable 3is binary (e.g., only black or white) rather than continuous (e.g., an infinite list of potential colors) | Classification |
| Decision tree | Highly interpretable classification or regression model that splits data-feature values into branches at decision nodes (e.g., if a feature is a color, each possible color becomes a new branch) until a final decision output is made | Regression Classification |
| Naive Bayes | The Bayesian method is a classification method that makes use of the Bayesian theorem. The theorem updates the prior knowledge of an event with the independent probability of each feature that can affect the event. | Regression Classification |
| Support vector machine | Support Vector Machine, or SVM, is typically used for the classification task. SVM algorithm finds a hyperplane that optimally divided the classes. It is best used with a non-linear solver. | Regression (not very common) Classification |
| Random forest | The algorithm is built upon a decision tree to improve the accuracy drastically. Random forest generates many times simple decision trees and uses the ‘majority vote’ method to decide on which label to return. For the classification task, the final prediction will be the one with the most vote; while for the regression task, the average prediction of all the trees is the final prediction. | Regression Classification |
| AdaBoost | Classification or regression technique that uses a multitude of models to come up with a decision but weighs them based on their accuracy in predicting the outcome | Regression Classification |
| Gradient-boosting trees | Gradient-boosting trees is a state-of-the-art classification/regression technique. It is focusing on the error committed by the previous trees and tries to correct it. |
Supervised Machine Learning Algorithms
Here are the list of supervised machine learning algorithms which are explained below:
1. Linear Regression
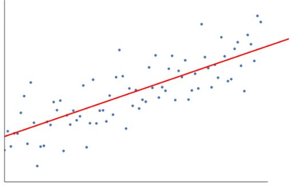
In linear regression, we will have a set of input variables that are used to determine a set of output variables. Let us say X is the education qualification and Y is the annual income, now we need to find the relation between them in form y = a+bx where a and b are coefficients which linear regression needs to find by drawing a line that passes through most of the data points. So that we can predict accurate output for the given output with less error.
2. Logistic Regression
In logistic regression, we classify the input data into two categories like True or False by drawing a line between them using a transformation function. Logistic regression function looks like h(x) = 1/ 1 + e^-x. This model is based on the probability of the class or other which is binary. It is mostly used for binary classification problems where we can separate the data by a single line and as the baseline for evaluating complex problems. Its probability is either 0 or 1; if it is 1 then it’s a default class. For example, predicting an Email is spam or not, becoming spam will be 1 and not is 0.
3. K Nearest Neighbor (KNN)
In KNN, it categorizes the objects based on the nearest neighbor in the dataset. It assumes an object nearest to it will be similar to the object and uses different methods to find the nearest neighbor such as Euclidean, cosine, Hamming distance, city block, etc. It can be best used when we want to have a benchmark learning rules algorithm, when there is no memory usage constraint, and when the prediction speed of the trained model is a low concern. It uses the entire dataset as a training set instead of splitting into training and test data sets. When an output is required for a new dataset, the algorithm goes through the entire data set and finds k- nearest neighbor where k is given by the user.
4. Naïve Bayes

In the Naïve Bayes regression technique, it calculates the probability of an event where a particular event has already occurred. Here event is a variable and already occurred event is a hypothesis and Bayes theorem is p(h/d) = p(d/h) * p(h)/p(d). It classifies new input data based on the high probability of its particular class. It is best used when we have a small dataset with more parameters, need a classifier that is easy to interpret, when we know that scenarios will occur which are not in training dataset such as medical or financial applications, etc.
5. Non-Linear regression
In the non-linear regression technique, it is a statistical modeling technique where it helps to describe nonlinear relationships in experimental data where the model is parametric. Nonlinear refers to a fit function which is a nonlinear function of parameters such as y = b0 +b1x + b2x^2 where b0, b1, b2 are fitting parameters is a linear regression whereas nonlinear regression for the fitting parameters is y = (b0x^b1)/(x+b2). It is best used when data has more nonlinear tends which cannot be transformed into linear space.
Advantages and Disadvantages
Here are the advantages & disadvantages of supervised machine learning which are explained below:
Advantages
Some advantages are explained below:
- In this, we can easily understand what is happening compared to unsupervised learning.
- We can know how many classes are there in the model by seeing the data even before training.
- It is very useful for classification problems and no need to keep training data once training is done we can keep the required parameters in mathematical form.
- It can predict the large numeric values from the given data set and corresponding labels.
Disadvantages
Some disadvantages are explained below:
- It cannot handle or solve the most complex problems/tasks in machine learning.
- It can predict only known but not unknown data like unsupervised learning.
- It cannot find the features on its own by forming clusters or by classification.
- It cannot give accurate results if the corresponding class is not in the training data set.