
Introduction to Data Frames in R
Data frames in R language are the type of data structure that is used to store data in a tabular form which is of two dimensional. The data frames are special categories of list data structure in which the components are of equal length. R languages support the built-in function i.e. data.frame() to create the data frames and assign the data elements. R language supports the data frame name to modify and retrieve data elements from the data frames. Data frames in R structured as column name by the component name also, structured as rows by the component values. Data frames in R is a widely used data structure while developing the machine learning models in data science projects.
There are some characteristics of the data frame.
- The column name is required
- Row names should be unique
- The number of items in each column should be the same
Steps For Creating Data Frames in R
Let’s start with creating a data frame which is explained below,
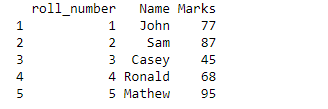
Step 1: Create a Data Frame of a Class in a School.
Code:
tenthclass = data.frame(roll_number = c(1:5),Name = c("John","Sam","Casey","Ronald","Mathew"),
Marks = c(77,87,45,68,95), stringsAsFactors = FALSE)
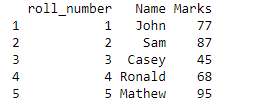
print(tenthclass)
When we run this code we will get a data frame like this.
Output:
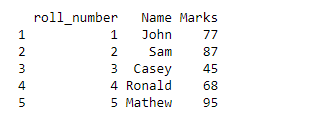
Here in our example, the data frame is very small, but in real life, while dealing with the problem we have lots of data. So to understand the structure of data we pass on the function Str().
Step 2: We add the below line in our code.
Code:
Str(tenthclass)
When we run the whole code we will get output.
Output:
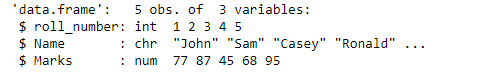
The above output means we have 5 observations of 3 variables. Then it explains the data type of each variable. Like in our example roll number is an integer, the name is character and Marks are numbered.
Once we understand the structure of the data, then we will pass the below-mentioned code to understand the data more statistically.
Step 3: Now, we will use a summary() function
Code:
summary(tenthclass)
Output:
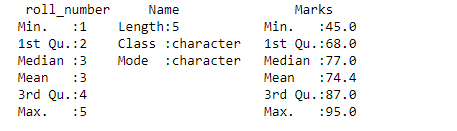
The summary provides a better understanding of our data. It will tell us to mean, median, quartile, Max and Min. These things will help us to make a better decision.
Structure of Data Frame
When we want to know the structure of a particular data frame. We can use the below function.
Star ()
str(Data_frame)
Output:
Number: num 2 3 4
alpha: Factor w/ 3 levels “x”,”y”,”z”: 1 2 3
Booleans: logi TRUE TRUE FALSE
How to Extract Data from Data Frames in R?
Here we will continue the above case. Let’s suppose we want to know the name of the student in class tenth, just name. So how we will extract?
Our data frame looks like this.
roll_number Name Marks
1 1 John 77
2 2 Sam 87
3 3 Casey 45
4 4 Ronald 68
5 5 Mathew 95
To just get the name as an output we will pass on the following code.
Code:
onlyname = tenthclass$Name
print(onlyname)
Output:

Here if we break the code, we just put the dollar sign in between the name of our data frame and the name of the variable which we want as an output.
Now consider a situation, the teacher wants to know everything about roll number 2 like what his name is and how much he scored.
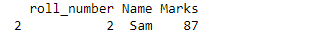
Here we need everything about roll number 2 so we will pass on the below-mentioned code.
Code:
result_rollnumber2 = tenthclass[c(2),c(1:3)] print(result_rollnumber2)
Output:
Expand in Data Frames
The data frame can be increased and decrease in size by adding or deleting columns and rows.
1. Add Row
We have two data frames. One data frame belongs to class tenth section A and other data frame belongs to class tenth section B. Now these different sections are merging into a single class.
Example #1
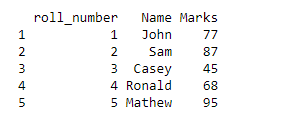
Class 10 A
Code:
tenthclass_sectionA = data.frame(roll_number = c(1:5),
Name = c("John","Sam","Casey","Ronald","Mathew"),
Marks = c(77,87,45,68,95), stringsAsFactors = FALSE)
print(tenthclass_sectionA)
Output:
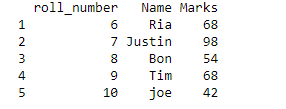
Example #2
Class 10 B
Code:
tenthclass_sectionB = data.frame(roll_number = c(6:10),Name = c("Ria","Justin","Bon","Tim","joe"),
Marks = c(68,98,54,68,42), stringsAsFactors = FALSE)
print(tenthclass_sectionB)
Output:
Example #3
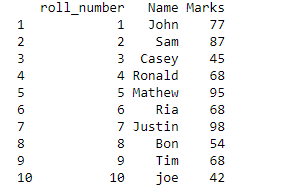
rbind() function
Now we have to merge these both classes into a single class. We will use rbind() function here. The only limitation in adding a new row is that we need to bring in the new rows in the same structure as the existing data frame.
Code:
new_tenthclass = rbind(tenthclass_sectionA,tenthclass_sectionB)
print(new_tenthclass)
Output:
2. Add Column
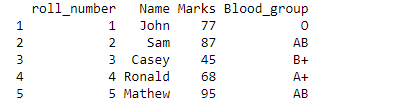
Now consider a case wherein we have to add blood group details of each and every student in class 10. We will add a new column for it and name it as “Blood_group”.
Our data frame looks like this.
Code:
tenthclass = data.frame(roll_number = c(1:5),Name = c("John","Sam","Casey","Ronald","Mathew"),
Marks = c(77,87,45,68,95), stringsAsFactors = FALSE)
print(tenthclass)
Output:
Code:
tenthclass$Blood_group = c("O","AB","B+","A+","AB")
print(tenthclass)
Output:
3. Delete Column
Code:
print(tenthclass)
Output:
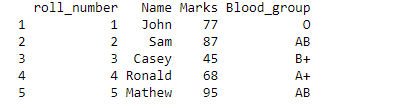
In this data frame if we have to delete the blood group variable (Rightmost column) we will pass the below code.
Code:
tenthclass$Blood_group = NULL
print(tenthclass)
Output:
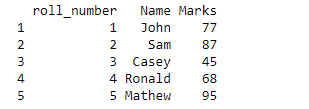
Bypassing NULL command we can directly remove the variable from our data frame.
5. Delete Row
Code:
print(tenthclass)
Output:
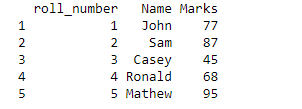
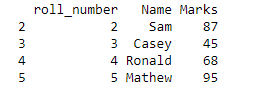
Now consider a situation where we don’t need marks of John, so we have to remove the topmost row.
Code:
tenthclass = tenthclass[-1,] print(tenthclass)
Output:
6. Update Data in Data Frame
Code:
print(tenthclass)
Output:
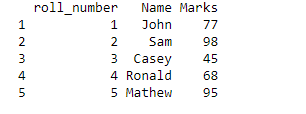
Let’s suppose Sam scored 98 marks but as per our data frame marks are 87. So we can pass the below code to rectify it.
Code:
tenthclass$Marks[2] = 98
print(tenthclass)
Output:
Inspecting Data Frames
Below are the different ways to inspect a data frame and provides information about a data frame just like the above star function.
1. Names- Provides the names of the variables in the dataframe
Syntax :names(data frame name)
Example
Number <- c(2,3,4)
alpha <- c("x","y","z")
Booleans <- c(TRUE,TRUE,FALSE)
Data_frame <- data.frame(Number,alpha,Booleans)
names(Data_frame)
output: [1] “Number” “alpha” “Booleans”
2. Summary- Provides the statistics of the data frame.
Syntax:summary(data frame name)
Example
Number <- c(2,3,4)
alpha <- c("x","y","z")
Booleans <- c(TRUE,TRUE,FALSE)
Data_frame <- data.frame(Number,alpha,Booleans)
summary(Data_frame)
Output:
Number alpha Booleans
Min. :2.0 x:1 Mode :logical
1st Qu.:2.5 y:1 FALSE:1
Median :3.0 z:1 TRUE :2
Mean :3.0 NA’s :0
3rd Qu.:3.5
Max. :4.0
3. Head- Provides the data for the first few rows.
Syntax: Head( name of the data frame)
Example
Number <- c(2,3,4,5,6,7,8,9,10,11)
alpha <- c("x","y","z","a","b","c","d","f","g","j")
Booleans <- c(TRUE,TRUE,FALSE,TRUE,FALSE,FALSE,FALSE,FALSE,FALSE,FALSE)
Data_frame <- data.frame(Number,alpha,Booleans)
head(Data_frame)
Output:
Number alpha Booleans
1 2 x TRUE
2 3 y TRUE
3 4 z FALSE
4 5 a TRUE
5 6 b FALSE
6 7 c FALSE
4. Tail- Prints the last few rows in the data frame.
Syntax:tail( name of the data frame)
Number <- c(2,3,4,5,6,7,8,9,10,11)
alpha <- c("x","y","z","a","b","c","d","f","g","j")
Booleans <- c(TRUE,TRUE,FALSE,TRUE,FALSE,FALSE,FALSE,FALSE,FALSE,FALSE)
Data_frame <- data.frame(Number,alpha,Booleans)
tail(Data_frame)
Output:
Number alpha Booleans
5 6 b FALSE
6 7 c FALSE
7 8 d FALSE
8 9 f FALSE
9 10 g FALSE
10 11 j FALSE
Extracting Specific Data from the Data Frame
Below is some specific extraction of data from the data frame:
1. Using the Column name
We can extract a particular set of data from the data frame.
From our example above, let’s extract only the first column from the data frame which is Number.
Data_ frame <- data. Frame(Number)
Output:
Number
1 2
2 3
3 4
2. Using the rows
We can extract the data from the rows just like the below example.
Let’s suppose we want to print only two rows of the Number column.
Number <- c(2,3,4)
alpha <- c("x","y","z")
Booleans <- c(TRUE,TRUE,FALSE)
Data_frame <- data.frame(Number,alpha,Booleans)
print(Data_frame)
output <- Data_frame[1:2,] print(output)
Output:
Number alpha Booleans
1 2 x TRUE
2 3 y TRUE
3 4 z FALSE
———————————-
Number alpha Booleans
1 2 x TRUE
2 3 y TRUE
We can observe the difference in the first and second outputs.
3. Printing specific rows and columns
We can also print specific rows and columns.
In the below example, we print 1st and 2nd rows, columns
Number <- c(2,3,4)
alpha <- c("x","y","z")
Booleans <- c(TRUE,TRUE,FALSE)
Data_frame <- data.frame(Number,alpha,Booleans)
print(Data_frame)
output <- Data_frame[c(1,2),c(1,2)] print(output)
Output:
Number alpha Booleans
1 2 x TRUE
2 3 y TRUE
3 4 z FALSE
————————————-
Number alpha
1 2 x
2 3 y
4. Adding another column to the data frame
We can add another column along with values to the data frame.
Number <- c(2,3,4)
alpha <- c("x","y","z")
Booleans <- c(TRUE,TRUE,FALSE)
Data_frame <- data.frame(Number,alpha,Booleans)
Data_frame$class <- c("A","B","C")
out <- Data_frame
print(out)
Output:
Number alpha Booleans class
1 2 x TRUE A
2 3 y TRUE B
3 4 z FALSE C
5. Adding a row to the data frame
We use the rbind function to add a new row to the existing data frame.
Number <- c(2,3,4)
alpha <- c("x","y","z")
Booleans <- c(TRUE,TRUE,FALSE)
Data_frame <- data.frame(Number,alpha,Booleans)
Data_frame$class <- c("A","B","C")
out <- rbind(Data_frame,c(5,"x",FALSE,"D"))
print(out)
Output:
Number alpha Booleans class
1 2 x TRUE A
2 3 y TRUE B
3 4 z FALSE C
4 5 x FALSE D
6. Combining both data frames
We can also combine two data frames to produce a single output.
To combine two data frames we need to have the same column for the data frames.
Number <- c(2,3,4)
alpha <- c("x","y","z")
Booleans <- c(TRUE,TRUE,FALSE)
Data_frame1 <- data.frame(Number,alpha,Booleans)
print(Data_frame1)
Number <- c(4,5,6)
alpha <- c("x","y","z")
Booleans <- c(TRUE,TRUE,FALSE)
Data_frame2 <- data.frame(Number,alpha,Booleans)
print(Data_frame2)
out <- rbind(Data_frame1,Data_frame2)
print(out)
Output:
Number alpha Booleans
1 2 x TRUE
2 3 y TRUE
3 4 z FALSE
—————————————–
Number alpha Booleans
1 4 x TRUE
2 5 y TRUE
3 6 z FALSE
—————————————–
Number alpha Booleans
1 2 x TRUE
2 3 y TRUE
3 4 z FALSE
4 4 x TRUE
5 5 y TRUE
6 6 z FALSE