
P-value helps us determine how likely it is to get a particular result when the null hypothesis is assumed to be true. It is the probability of getting a sample like ours or more extreme than ours if the null hypothesis is correct. Therefore, if the null hypothesis is assumed to be true, the p-value gives us an estimate of how “strange” our sample is.
If the p-value is very small (<0.05 is considered generally), then our sample is “strange,” and this means that our assumption that the null hypothesis is correct is most likely to be false. Thus, we reject it. Let us understand what is p-value through few examples:
Examples:
1. Tossing a Coin –
There are two possible outcomes – Heads (H), Tails (T). Let the null hypothesis be H0, and the alternative hypothesis be H1. H0: This is a fair coin; H1 This is a biased or an unfair coin. Let us assume that we are in a universe where the null hypothesis is true. Consider the following events –
| Event | p-value |
|---|---|
| T | 0.5 |
| T | 0.25 |
| T | 0.12 |
| T | 0.06 |
| T | 0.03 |
| T | 0.01 |
The p-value is the probability that the event occurs, assuming that H0 is true; that is, the coin is fair (if we were in the universe where H1 is true, then the p-value would be 1 for all the events). The occurrence of a tail once is quite regular, and for a fair coin, the probability of occurrence of Event 1 is 0.5. However, each time we toss the coin, the outcome is a tail! It is something doubtful to happen. Thus, the p-value decreases down the table. The probability that the tail occurs six times in a row is 0.01, which quite low. There is only a 1% chance that the event occurs in the universe where H0 is true (we must be super lucky for such a thing to happen).
Therefore, we reject the claim that the hypothesis is true as the p-value goes below 0.05 (after the 4th event). 0.05 is generally considered as the Statistical Significance.
2. Cookies and Nuts!! –
Mary sells chocolate nut cookies. Sadly, there was a complaint that there were fewer peanuts in the chocolate nut cookies than they are supposed to have (a pack of 200g is supposed to have 70g of peanuts). Hence, she wanted to check if the complaint was valid. To do so, she takes 20 random samples cookies from the population of 400 cookies, unwraps them and melts the chocolate to weigh the nuts in each packet. If the weights of peanuts in all the 20 samples were much more than 70g and the mean is about 95g, the complaint was definitely not valid. The nut quantity is, in fact, more. Consider that the weights of peanuts in all the 20 samples were much less than 70g, and the mean is about 30g. In this situation, there is a problem with cookies.
Here our null hypothesis (H0) and the alternative hypothesis (H1) are as follows:
- H0 – Mean weight of peanuts in a packet = 70g (there is no problem with the cookies).
- H1 – Mean weight of peanuts in a packet < 70g.
If the weights of peanuts in all the packs are in the range (65,75) that is close to 70g, and the mean is around 68.5g, it is difficult to decide if our claim that H0 is true is correct. In such cases, we find the p-value for this data compared with the mean of 70g. Suppose that the p-value we got is 0.18. Hence, there is an 18% chance of getting a mean as low as this (68.5g) if there is nothing wrong with the cookies (H0 is true) that is mean weight of peanuts in the cookies >= 70g (Mary is relieved!).
If the p-value we obtained were less than the significance level of 0.05, we would reject the null hypothesis.
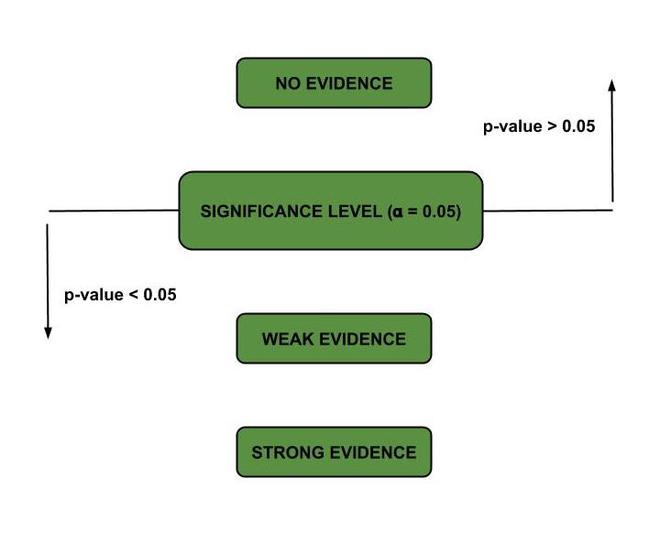
P-value demonstration
Thus, p-value tells us if we have evidence from the sample that there is an effect on the population. If the p-value is higher than the significance level, we have no proof. As the p-value goes below the significance level, our evidence gets more potent, and hence we can reject the claim that the null hypothesis is correct.
The procedure we use to find how strong the evidence is is as follows –
- Assume that H0 is true.
- Take a sample, get the statistic (mean), and work out how likely it is to get such figures if H0 is true. The parameter which tells us the former is the p-value.
- If the p-value is quite small, H0 is probably wrong. The lower the p-value, the more evidence we have that the null hypothesis is false.
- If the p-value is large, our original idea of assuming H0 to be true is probably correct. Hence, we do not reject H0 – non-significant result.
- P-value is small or large compared to the Significance level, which is generally 0.05. It is adjusted based on the experiment and how we use its results.
Therefore, the p-value is not –
- The probability that the claim is valid.
- The probability that the null hypothesis is true.
It is the parameter that helps us determine how “strange” the sample is under the assumption that the null hypothesis is correct. Thereby, it helps us to modify the null hypothesis accordingly.