
What Are Hyperparameters?
When a model is being trained on a data set, it determines the best parameters for each predictor variable. This can be seen in a linear regression, where the coefficients are determined for each variable used in the model. The coefficients in this case are the parameters: they are found via the training process. Hyperparameters on the other hand are parameters that are independent of the training process — the data scientist sets them beforehand. For example, in random forest, a hyperparameter would be how many trees to include or how many nodes each tree can have. Parameters would be the criteria for each node, which the training process for the random forest finds. In short:
- Parameters are found by training the model
- Hyperparameters are set by the data scientist before training
I consider 3 main aspects to making a good model. One is what type of model to use — will it be a liner regression, a SVM, or a random forest? The second one is what independent variables to include in that model (a.k.a feature selection). After these tasks are complete the third aspect to consider is hyperparameter tuning, which is finding the best hyperparameters to use. This is why you should care about hyperparameter tuning: it has the ability to drastically improve the accuracy of your model, just like model selection or feature selection.
Introductory Example
So if the best parameters are found by training the model, how are the best hyperparameters found? Do data scientists just randomly set them and hope for the best? What they do is make many different models, each with a unique set of hyperparameters. The model that performs the best on the test set will be deemed to have the best hyperparameters. This is done using cross validation. An example, illustrated below, is when tree models are being made with one hyperparameter, and four different values for that hyperparameter are being tested. Each color tree represents a different tree model (even though they have the same shape — think of it as an icon of a tree model)
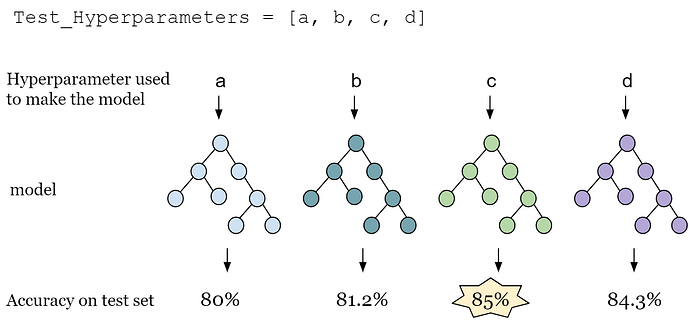
Now, what hyperparameter values are usually tested? In other words, what are the values of a, b, c, and d in the image above? Usually these values fall within a range set by the data scientist. This is because we want to avoid overfitting and find a sweet spot (as well as reduce the run time). If we decided the range of the hyperparameter in the example above was from 1 to 10, then instead of testing 1,1.01, 1.02 all the way to 10, we use 1, 5, and 10.
Grid Search and Random Search
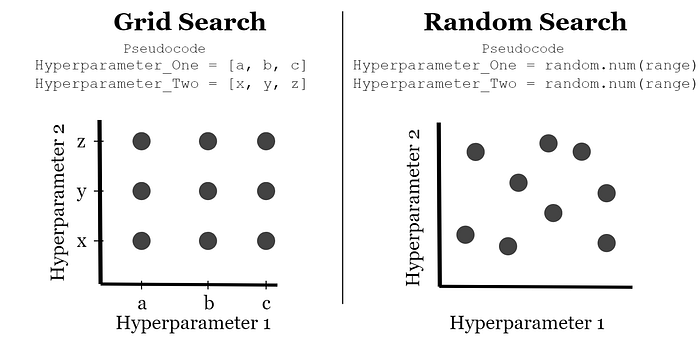
Most of the times we have more than one hyperparameter. Since we have already visualized one hyperparameter, let’s visualize two. To do this we will plot the two hyperparameters on the x and y axis. In this plane, the range of each axis is the range of hyperparameters we want to consider. Now obviously because of computational power we can’t consider all the values between the max and the min, so how to we pick with values to test? There are two different methods to do this: grid search and random search
Grid search is where you pick x number of values that are evenly spaced along each axis (similar to our introductory example). This forms a grid — hence the name. Random search is when x-squared number of values are picked randomly. Both cases generate x-squared number of points. This can be visualized below (x=3):
This is great and all, but which method is better? Well, we defined better by how well a model with a combination of hyperparamters performs on a test set. We can use these visualizations to see this. Imagine that the color of the background indicates how accurate that combination is. Let’s say white means that this certain point performs well, and blue means it doesn’t.

Remember, these are two arbitrary hyperparameters that aren’t necessarily equal in importance. What if hyperparameter 1 is more important than hyperparameter 2? That means a small change in hyperparameter 1 is more important than a change in hyperparameter two. It’s like hyperparameter two doesn’t matter: as long as hyperparameter 1 is the right values the model will be accurate despite whatever value hyperparameter 2 is. This is shown below:
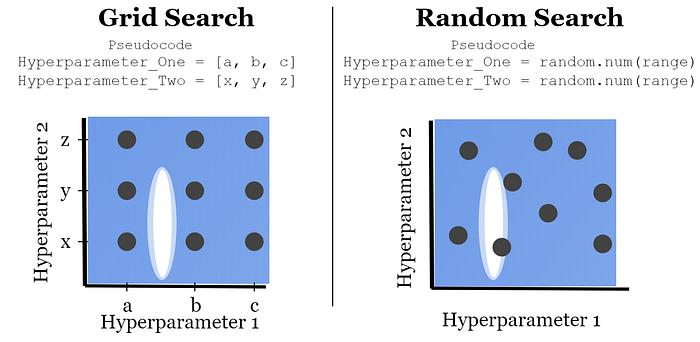
We can see here that random search does better because of the way the values are picked. In this example, grid search only tested three unique values for each hyperperameter, whereas the random search tested 9 unique values for each. That means if one hyperparameter is more important than the others, random search will be better. Think of it this way: if hyperparameter 2 doesn’t really matter, then we would want 9 different hyperparameter 1 values to test instead of 3. The same holds true for higher dimensions (more hyperparameters).
Implementation in Python
Now following that explanation of what hyperparameter tuning is, we can finally get to the good stuff: implementing it in Python. For this we will use a logistic regression which has many different hyperparameters. For this example we will only consider these hyperparameters:
- The C value
- The penalty (L1 or L2)
- The type of solver used to train the logistic regression.
The data set we will be using is the classic and simple iris data set. First we need to import the things we need, as well as separate the target variable from the independent variables
import numpy as np
from sklearn import linear_model, datasets
from sklearn.model_selection import GridSearchCViris = datasets.load_iris()
features = iris.data
target = iris.target
Now that we have this, we need to generate the different hyperparameter values. For C we can use np.logspace, which takes the endpoints of a range, generates num numbers evenly spaced in that range, and then takes another number (10 is the default) and raises it to each number it generated.

- to generate the different types of penalties we just make a list with them
- For the solvers, since we are using both penalties, we can only use liblinear and saga. These are also in a list
C = np.logspace(0, 4, num=10)
penalty = ['l1', 'l2']
solver = ['liblinear', 'saga']
Then we put these hyperparameters into a dictionary. The keys are the same name as the variables just for simplicity
hyperparameters = dict(C=C, penalty=penalty, solver=solver)
Then we need to make a sklearn logistic regression object because the grid search will be making many logistic regressions with different hyperparameters. Then we pass the GridSearchCV (CV stands for cross validation) function the logistic regression object and the dictionary of hyperparameters. Once this is done we need to fit the GridSearchCV to our feature variables and target variable. Then we can print out the best estimators.
logistic = linear_model.LogisticRegression()
gridsearch = GridSearchCV(logistic, hyperparameters)best_model = gridsearch.fit(features, target)
print(best_model.best_estimator_)
My code printed out the best hyperparameters (along with other ones I didn’t test for):
- C = 166.81005372000593
- penalty = l2
- solver= liblinear
Here is the full code snippet:
import numpy as np
from sklearn import linear_model, datasets
from sklearn.model_selection import GridSearchCViris = datasets.load_iris()
features = iris.data
target = iris.targetC = np.logspace(0, 4, num=10)
penalty = ['l1', 'l2']
solver = ['liblinear', 'saga']hyperparameters = dict(C=C, penalty=penalty, solver=solver)logistic = linear_model.LogisticRegression()
gridsearch = GridSearchCV(logistic, hyperparameters)best_model_grid = gridsearch.fit(features, target)
print(best_model_grid.best_estimator_)
The code is very similar for random search, however each run will output a different values. This is because it is random search. So you can run it a few times if you want (or have the time to).
from sklearn.model_selection import RandomizedSearchCVrandomizedsearch = RandomizedSearchCV(logistic, hyperparameters)
best_model_random = randomizedsearch.fit(features, target)
print(best_model_random.best_estimator_)
Summary
- Parameters are found when a certain type of model is trained on a data set.
- Hyperparameters are aspects of a model that are set before training by the data scientist. They can be optimized using grid search or random search.
- Grid search generates evenly spaced values for each hyperparameter being tested, and then uses cross validation to test the accuracy of each combination
- Random search generates random values for each hyperparameter being tested, and then uses cross validation to test the accuracy of each combination.
- Random search is better than grid search because it can take into account more unique values of each hyperparameter. This is important because some hyperparamters are more important than others.